Executive Summary
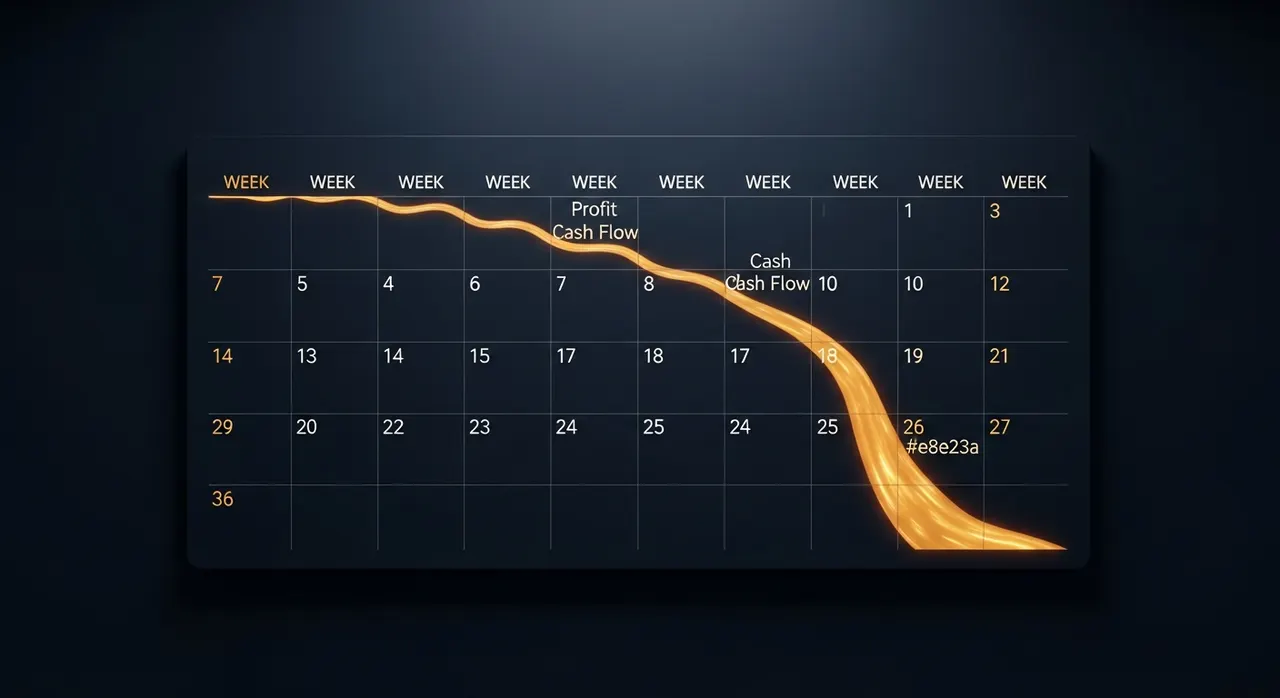
Every eCommerce operator has a revenue target. Almost none have a break-even target. Revenue tells you how much money moved through your business. Break-even tells you when your business starts making money — and those are two very different questions.
80% of eCommerce businesses fail within their first two years. The failure mode is rarely "nobody bought the product." It is almost always "the product sold, the business grew, and the money ran out before the math worked." That is a break-even problem.
eCommerce brands lose an average of $29 on every new customer acquired. Your break-even calculation determines how many repeat purchases it takes to recover that loss — and whether your business model can survive long enough to get there.
The Cost Structure Nobody Maps Completely
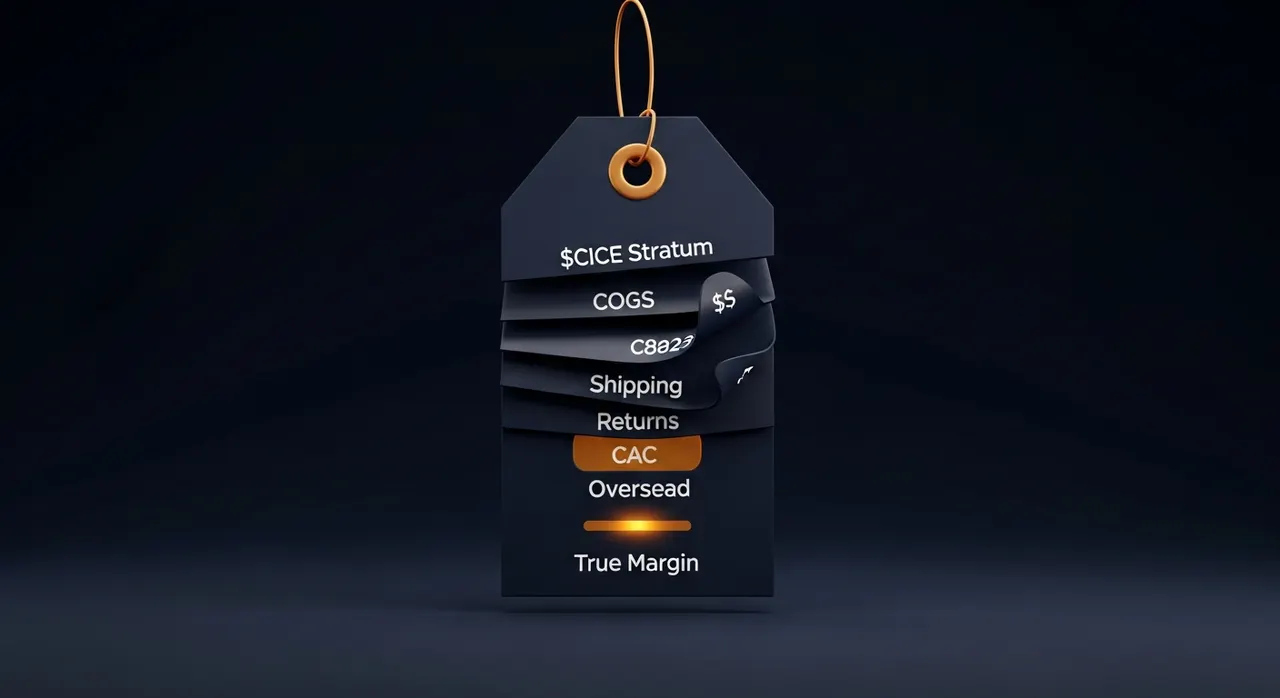
The typical break-even analysis includes COGS, marketing spend, and platform fees. It misses at least four cost categories that collectively represent 15-25% of the true cost per order.
The fulfillment undercount
The Three Break-Even Timelines
Break-even timelines vary dramatically by business model. The operator who doesn't know which model they're running will build the wrong financial plan.
| Model | Break-Even Timeline | Why | Cash Requirement |
|---|---|---|---|
| DTC (Own Store) | 12–24 months | High CAC, brand building, inventory investment upfront | 6–12 months of operating costs in reserve |
| Marketplace (Amazon, etc.) | 3–6 months per product | Lower CAC (built-in traffic), but margin compression from fees | 3–6 months per product launch |
| Dropship | 6–12 months | No inventory risk, but thin margins (15–25%) and limited differentiation | Marketing budget for 6–12 months of testing |
The model confusion trap
The Real Contribution Margin Calculation
Contribution margin is the foundation of break-even analysis. Most operators calculate it wrong because they leave out variable costs that scale with every order.
The formula most operators use:
Revenue - COGS = Gross Profit
Gross Profit / Revenue = Gross Margin (%)
The formula that actually predicts break-even:
Revenue - COGS - Shipping - Platform Fee - Payment Processing
- Return Allowance - Packaging = Contribution Margin
Run this on your last 90 days
- Revenue: $65.00
- COGS (30%): -$19.50
- Shipping (12%): -$7.80
- Platform (3%): -$1.95
- Payment (3%): -$1.95
- Returns allowance (4%): -$2.60
- Packaging: -$2.00
Contribution margin: $29.20 (44.9%)
Every dollar of fixed cost (rent, tools, salaries, marketing) needs to be covered by that $29.20 per order. At $10K/month in fixed costs, you need 343 orders per month just to break even — roughly 11 orders per day, every day.
The benchmark contribution margin for a typical $65 AOV eCommerce business is approximately 48.9% — but that assumes operators have actually tracked and optimized every variable cost line. Most haven't.
The Costs That Kill Break-Even Projections
Four cost categories consistently destroy break-even timelines because operators either don't track them or underestimate them.
1. Return Processing Costs
Returns don't just reduce revenue. They add cost. Every return creates a reverse logistics event with its own cost structure.
At a 20% return rate (the current eCommerce average of 20.8%), one in five orders generates this cost instead of profit. Your break-even calculation must include a return allowance or it's fiction.
2. Storage and Warehousing
Storage costs at $0.45-$0.75 per cubic foot per month don't sound significant. They become significant when slow-moving inventory occupies warehouse space for 90-120 days. A pallet of product that takes 4 months to sell at $0.60/cu.ft costs $144-$288 in storage alone — before it generates a single dollar of revenue.
3. Packaging
At approximately $2.00 per order, packaging is individually small but collectively meaningful. At 500 orders per month, that's $12,000 per year. Branded packaging (custom boxes, tissue paper, inserts) pushes this to $3.50-$5.00 per order.
4. Chargebacks
Chargebacks cost $20-$100 per incident (the chargeback fee plus the lost revenue plus the product). At even a 0.5% chargeback rate on 1,000 monthly orders, that's 5 chargebacks costing $100-$500/month in fees alone — plus the lost product and revenue.
The Real-World Test: Three Operator Profiles
Profile A: DTC Skincare Brand ($45 AOV, 70% Gross Margin)
High margin looks comfortable until you add acquisition costs. At $29 average loss per new customer, this operator needs each customer to place 2.3 orders before they contribute a dollar of profit. With a 30% repeat purchase rate, only 3 in 10 customers ever reach that threshold. Break-even timeline: 18-24 months, heavily dependent on email-driven retention.
The break-even question this operator should ask: "What is my repeat purchase rate, and does my retention spend generate enough second orders to recover the first-order loss within 12 months?"
Profile B: Amazon FBA Electronics ($120 AOV, 35% Gross Margin)
Lower gross margin, but Amazon's traffic reduces CAC to $8-$15 per customer. Break-even per product: 3-6 months. The risk is Amazon's fee structure — referral fees (8-15%), FBA fees ($3-$8/unit), and storage fees eat margin from three directions. An 11% return rate on electronics means one in nine sales becomes a reverse logistics event.
The break-even question this operator should ask: "After all Amazon fees, returns, and storage, does my per-unit contribution margin stay positive at current sales velocity — or am I subsidizing Amazon's logistics with my margin?"
Profile C: Dropship Home Goods ($85 AOV, 20% Gross Margin)
Thin margin, no inventory risk. Break-even depends almost entirely on ad efficiency. At 20% gross margin, contribution margin after payment processing and platform fees is roughly 14-15%. Every dollar of marketing spend must generate $7+ in revenue just to break even on acquisition. A single percentage point increase in return rate (currently averaging 20.8% industry-wide) can eliminate the entire margin.
The break-even question this operator should ask: "Can I sustain a CAC below $12 across all channels for the next 6 months — and what happens to my P&L if return rates climb from 20% to 25%?"
The Decision Point
Break-even analysis is not a one-time exercise. It's a monthly diagnostic that answers one question: is this business moving toward profitability, away from it, or standing still?
Key Takeaway
Related Decisions
If this analysis changes how you think about your cost structure and break-even timeline, two related articles deepen the picture:
- The Real Cost of Your eCommerce Tool Stack — Tool subscriptions are fixed costs that raise your break-even point. Every $100/month tool adds $1,200/year to the revenue you need before profit starts. Most operators are carrying 30-40% more tool cost than they realize.
- The Inventory-Cash Flow Trap at $50K/Month — Break-even on paper and cash in the bank are two different things. This article explains why profitable businesses run out of money — and the cash conversion cycle math that predicts when it happens.