By Diosh — Founder, AHAeCommerce | eCommerce decision intelligence for $50K–$5M GMV operators
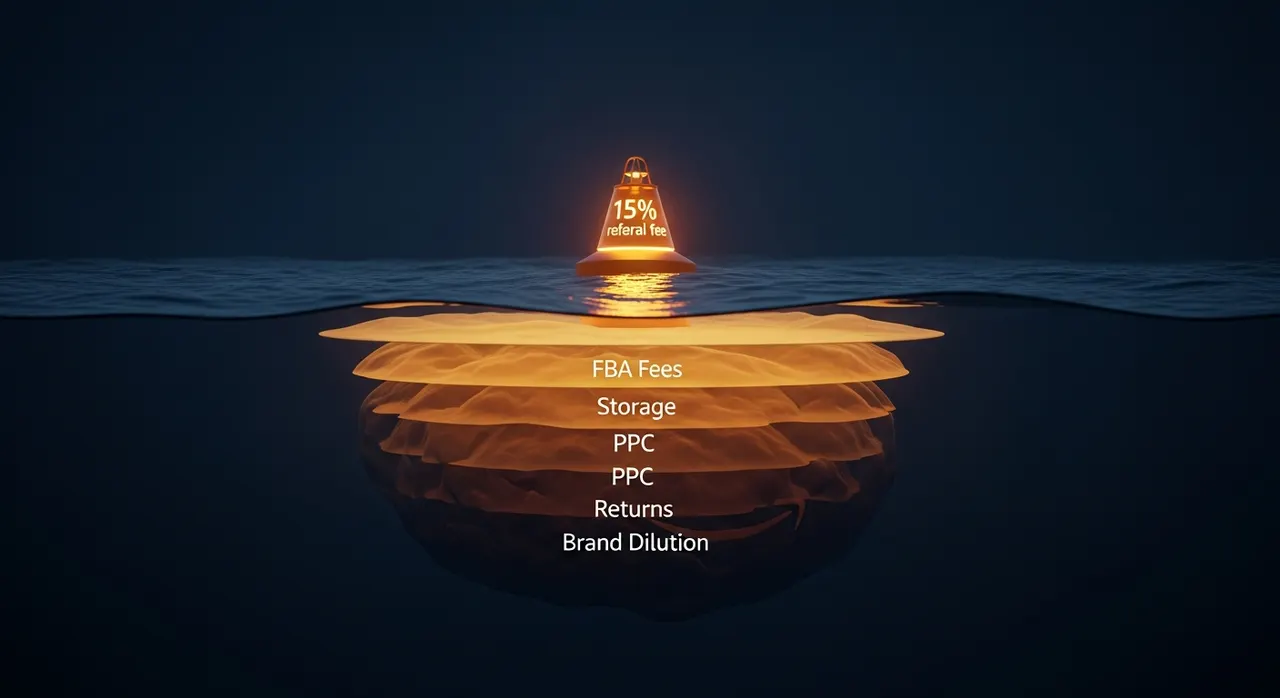
Amazon's 15% referral fee is the line on the seller agreement. The real Amazon take rate, once you stack FBA fulfillment ($4.75 average), storage ($0.40/unit), PPC advertising (10–15% of revenue), returns processing ($1.20 allocated), and A+ content investment ($800–$3,000/SKU amortized), runs 38–50% of gross revenue for most brands. The 15% headline is the cost the marketplace agreed to make visible. The other 23–35 percentage points live in line items that don't get added up when sellers compare channel economics.
Marketplace fees are the most consistently understated cost line in eCommerce reporting. Sellers compare Amazon's "15%" to Shopify's "2.9% + $0.30" and conclude their own store keeps 12 more points — when the actual take rate gap between Amazon and a well-run DTC store is closer to 25–35 points after every cost is allocated correctly. The miscalculation drives channel mix decisions that look profitable on paper and aren't.
The Default Assumption (and Why It Fails)
The marketplaces publish a "referral fee" or "transaction fee" as their headline pricing — 15% for most Amazon categories, 6.5% + $0.20 listing for Etsy, 12.9–15% for eBay, 6–20% for Walmart depending on category. These rates are visible at the order level and accurate within their scope. They are also incomplete. Each marketplace runs ancillary services (fulfillment, advertising, premium listings, returns processing) that compound onto the referral fee — and that the seller pays for through optional-in-name-only programs that are operationally required to compete on the platform.
The relevant question is not "what is the referral fee?" It is "what is the all-in marketplace take rate after stacking every fee the platform charges and every optional spend that is operationally required to maintain ranking, conversion, and operational efficiency?"
What the Decision Actually Hinges On
The Stacked Fee Reality on Amazon (38–50% Take Rate)
Amazon's full fee stack for a brand running FBA with normal operational practices: referral fee (15% for most categories, 8% for some apparel subcategories) + FBA fulfillment fee ($3.45–$5.55 for standard-size items per Amazon's FBA Fee Schedule, 2024) + FBA storage ($0.87/cubic foot/month for standard, $2.40 for peak Q4) + inbound shipping cost to Amazon FCs (1–3% of revenue) + PPC advertising spend (8–15% of revenue typical, higher for competitive categories) + return processing (Amazon allocates return cost to seller) + brand store / A+ content investment (amortized over SKU life).
Stacking these for a $40 AOV product produces total fees of $15.20–$20.40 per order — 38%–51% of revenue. The variance depends primarily on PPC intensity and category competition. Categories where organic ranking is achievable without significant PPC (early-mover positions, low competition) sit near the bottom of the range. Categories where PPC is required to maintain ranking (saturated categories, low-differentiation products) sit near the top.
The Lower-Fee Marketplaces Have Different Trade-offs
Etsy: 6.5% transaction fee + $0.20/listing + 3% payment processing + 12–15% Etsy Ads if you participate + offsite ad fee (15% on certain orders, mandatory for sellers above $10K/year) (Etsy Seller Handbook, 2024). The all-in take rate runs 18–28% for active sellers. Lower than Amazon, but the traffic volume and AOV are dramatically smaller — most Etsy sellers cannot scale revenue past $100–$300K without exhausting the platform's audience.
eBay: 12.9% final value fee + $0.30 per order + 1.3% international fee for cross-border + Promoted Listings (variable 2–15% additional for ranking visibility) (eBay Seller Center, 2024). All-in take rate for active sellers runs 18–25%. The audience demographics skew older and lower AOV than Amazon, but for refurbished, vintage, and parts categories, eBay still produces meaningful volume that Amazon doesn't.
Walmart Marketplace: 6–20% referral fee depending on category + Walmart Fulfillment Services (WFS) fees comparable to FBA + Sponsored Products advertising (8–12% to maintain ranking) + return processing. All-in take rate runs 25–35% — lower than Amazon but with a much smaller customer base (~140M unique monthly visitors vs. Amazon's 310M+). Walmart Marketplace works as a diversification channel for brands already established on Amazon; it does not work well as a primary channel for most categories.
The Channel Defensibility Question (Beyond Fee Math)
The take rate matters, and so does what each marketplace lets you do with the customer you acquired. Amazon: zero direct customer relationship; the customer belongs to Amazon. Etsy: limited customer relationship; you can market to repeat customers but with platform restrictions. eBay: weak customer relationship; the customer can be marketed to within strict platform rules. Walmart: zero direct customer relationship; same model as Amazon.
None of the marketplaces give you the customer relationship you get from DTC. The fee math is only one dimension of the comparison; the strategic value of the relationship the platform allows you to build matters at least as much over a 24-month horizon. Brands that optimize purely on take rate often end up with the lowest-take channel and the weakest customer asset — a tactical win and a strategic loss.
The Cost Reality
The following table shows the full take rate breakdown for a $40 AOV product across four marketplaces, assuming standard operational practices and active competition.
| Cost Line | Amazon (FBA, mature) | Etsy (active seller) | eBay (Promoted Listings) | Walmart Marketplace (WFS) | |---|---|---|---|---| | Referral / transaction fee | $6.00 (15%) | $2.60 (6.5%) | $5.16 (12.9%) | $4.80 (12%) | | Payment processing | included | $1.46 (3% + $0.25) | $0.30 fixed | included | | Fulfillment fee | $4.75 | $0 (self-fulfilled) | $0 (self-fulfilled) | $4.50 | | Storage allocation | $0.40 | $0 | $0 | $0.40 | | Advertising/promoted | $4.40 (11% PPC) | $4.80 (12% Etsy Ads) | $2.80 (7% Promoted) | $3.60 (9% Sponsored) | | Return processing allocation | $1.20 | $0.40 | $0.40 | $1.00 | | Offsite ad / listing fees | $0 | $1.20 (offsite + listing amortized) | $0 | $0 | | Total fees per $40 sale | $16.75 | $10.46 | $8.66 | $14.30 | | All-in take rate | 41.9% | 26.2% | 21.7% | 35.8% | | Customer relationship | None | Limited | Weak | None |
The all-in take rate gap between Amazon (42%) and eBay (22%) is 20 points. The gap between Amazon and DTC (~10% all-in for payment processing + own shipping) is over 30 points. The decision to allocate revenue across these channels is more consequential than the headline rates suggest.
The complement to this analysis is the Amazon vs own store channel mix decision — the take rate is the starting point, but the customer relationship the channel allows is the long-term value driver. Run the take rate model and the relationship model together, not separately.
The Trade-Off Map
Amazon: Volume and Discovery in Exchange for Margin and Customer
Amazon offers unmatched audience scale and category-keyword search volume that no other marketplace produces. For brands in mainstream consumer categories with broad appeal, Amazon is the fastest path to $500K–$2M GMV. The cost is the 38–50% take rate and the complete absence of customer relationship. Use Amazon when the priority is volume velocity over margin or customer ownership; use it as a diversification channel when DTC is the priority.
Etsy: Lower Fees, Specific Audience, Volume Ceiling
Etsy works for handmade, vintage, craft supply, and design categories where its audience is concentrated. Take rate is meaningfully lower than Amazon, and the audience values the differentiation. The trade-off: total addressable market on Etsy is materially smaller than Amazon, and most categories outside Etsy's core (handmade, vintage, art) don't get meaningful organic discovery. For most brands, Etsy is a supplemental channel at $30K–$150K/year revenue ceiling.
eBay: Niche Categories, Older Demographic, Specific Use Cases
eBay's audience and category strength is concentrated: refurbished electronics, parts and accessories, vintage and collectibles, and certain specialty consumer goods. For brands in these categories, eBay produces volume that other marketplaces don't. For mainstream consumer goods, eBay is rarely the primary channel — it serves as a clearance or overflow channel for inventory that Amazon won't accept or for customer segments that Amazon doesn't reach.
Walmart Marketplace: Amazon Lite for Diversification
Walmart Marketplace is structurally similar to Amazon — managed fulfillment, sponsored product advertising, no customer relationship — at a slightly lower take rate and dramatically lower volume. For brands established on Amazon, Walmart provides 15–30% incremental volume at marginally better unit economics. As a primary channel, Walmart works for a small number of categories (Walmart-aligned consumer staples, food, household). For most brands, Walmart is a 6–12 month diversification project, not a foundation.
When to Act (Specific Triggers)
Trigger 1: Calculate Actual Take Rate Quarterly per Channel
Pull each marketplace's seller statement for the last 90 days, sum every fee line item plus advertising spend allocated to that channel, divide by gross revenue. If you have never done this calculation per channel, the first run is usually surprising — most operators discover the all-in take rate is 8–15 points higher than they assumed. Run it quarterly to track drift.
Trigger 2: Reassess Channel Mix at Major Fee Changes
Each marketplace makes annual fee adjustments. Amazon raised FBA fees in 2024 with category-specific increases of 5–15%. Etsy added the offsite ad fee in 2020 for sellers above $10K. Walmart shifted commission rates by category. Within 60 days of any major fee change announcement, recalculate the all-in take rate and assess whether the channel still makes economic sense at the new structure.
Trigger 3: Reduce PPC When ACoS Exceeds Contribution Margin
The advertising line is the most controllable component of marketplace take rate. When Amazon ACoS (Advertising Cost of Sales) exceeds contribution margin on a SKU, the PPC spend is destroying value — every additional sale costs more than its contribution. Cut PPC on SKUs with ACoS above contribution margin; reallocate the spend to higher-margin SKUs or pull it entirely. Most brands carry 5–15% of SKUs that are unprofitable under advertising at current bid levels.
Trigger 4: Build DTC When Marketplace Concentration Exceeds 60%
If marketplace revenue (any single marketplace, particularly Amazon) exceeds 60% of total revenue for 6+ months, the concentration risk has become structural. Initiate the DTC channel investment regardless of the short-term ROI difference — the strategic risk of channel concentration exceeds the operational cost of diversification at this threshold.
What Operators Get Wrong Most Often
Mistake 1: Comparing Headline Fees Across Channels
The single most common error is comparing Amazon's "15%" to Etsy's "6.5%" to Shopify's "2.9% + $0.30" as if those numbers were comparable. They aren't. Amazon's 15% is a fraction of the total cost stack; Shopify's 2.9% + $0.30 is almost the entire cost stack. Channel comparisons need to be made on all-in take rate including fulfillment, advertising, returns, and platform-specific costs. Anything else is comparing different things.
Mistake 2: Treating PPC as Optional
Amazon PPC is technically optional and operationally mandatory for most categories. The brand that doesn't run PPC ranks below the brands that do, gets fewer conversions, and over time loses organic placement to competitors who maintain advertising spend. Treating PPC as discretionary marketing rather than as a fixed cost of marketplace presence understates the true take rate by 8–15 percentage points.
Mistake 3: Ignoring Storage Fees Until They Hit Q4
FBA storage fees jump from $0.87 to $2.40 per cubic foot in Q4 (October–December) — a 2.75x increase. Brands that don't manage inventory levels heading into Q4 pay disproportionate storage costs precisely when sales are highest, compressing margin during the most important quarter. Active inventory management in Q3 — pulling slow movers, reducing safety stock on stable SKUs — produces meaningful Q4 storage cost reduction.
The Verdict
Marketplace fees are quoted as referral rates and incurred as take rates 2.5–3x larger. Amazon's 42% all-in take rate is the right number to plan against, not the 15% on the seller agreement. The channel mix decision depends on this number and on the strategic value of customer relationships each channel allows. Marketplaces optimize for short-term volume and weak relationships; DTC optimizes for long-term margin and strong relationships. The right allocation is both — but only if the take rate math is honest.
This week: Pull last quarter's seller statements for every marketplace you sell on, sum all fees and advertising spend, divide by gross revenue for that channel. If the all-in take rate on any channel exceeds 40% and you haven't been managing to that number, you are running channel mix decisions on bad data. The recalculation will reframe how you think about volume, margin, and the value of building DTC.