By Diosh — Founder, AHAeCommerce | eCommerce decision intelligence for $50K–$5M GMV operators
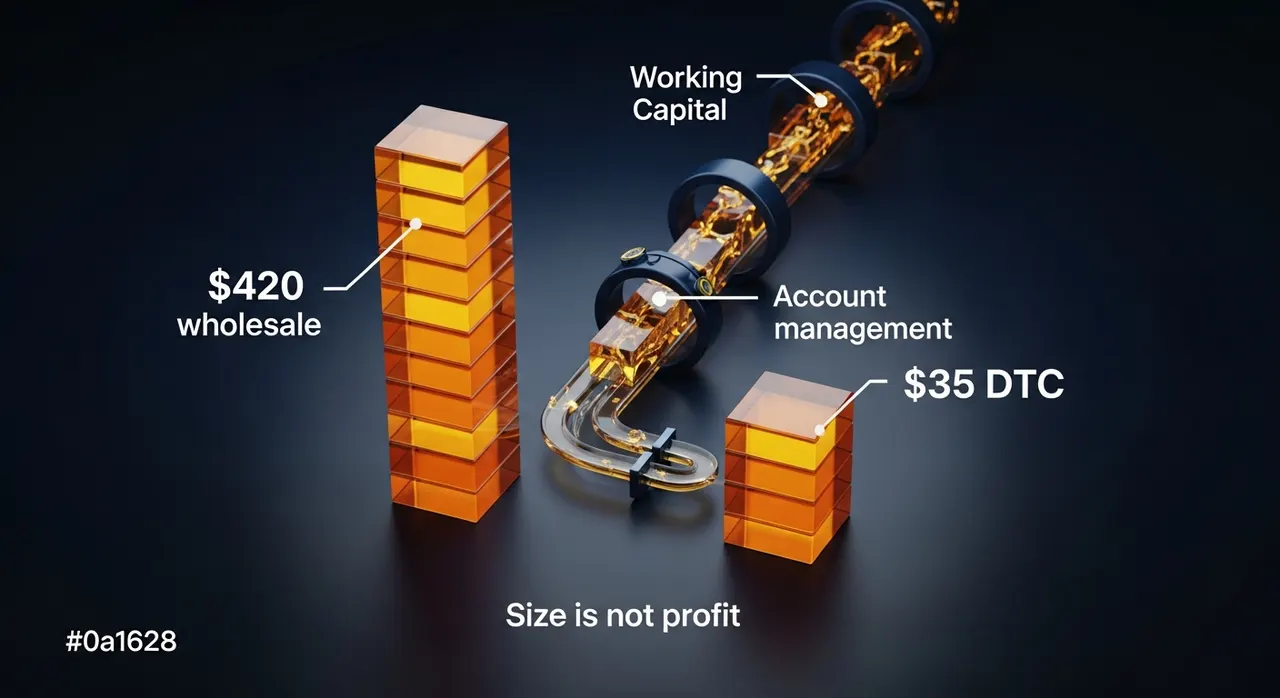
A DTC brand selling a $35 AOV product at 55% gross margin makes $19.25 per order and receives the cash in 2–3 days. The same brand selling to retail accounts at wholesale pricing — typically 50% of MSRP — receives $17.50 per unit (often shipped in 24-unit packs at $420 per order) but waits 45–75 days for payment under standard net terms. The B2B order looks dramatically more profitable on the AOV ($420 vs $35) and the gross margin per order is significantly higher in absolute dollars. The cash that finances inventory, payroll, and acquisition spend, however, arrives two months later — during which time the brand has to fund the inventory holding cost, the credit risk, and the account management overhead that DTC doesn't have.
DTC operators expanding into B2B routinely underestimate the working capital gap. The expansion looks like a margin-accretive move at the line-item level and turns into a cash-flow squeeze at the operational level — usually three to six months after the first wholesale shipments go out.
The Default Assumption (and Why It Fails)
The pitch for B2B expansion is straightforward: larger orders, lower acquisition cost per dollar of revenue, more predictable repeat behavior. All three are true on the order-level math. The pitch fails to mention the timing — B2B orders are paid in arrears, often with disputes, returns, and chargebacks that don't exist in DTC, and they require account management infrastructure that DTC doesn't need.
The standard wholesale pricing structure runs 50% of MSRP (a 50% discount from retail price). For a brand operating at 70% gross margin on DTC at MSRP, the wholesale margin is 40% — meaningfully lower per unit. The margin compression is the explicit cost. The cash conversion delay is the implicit cost, and it is usually larger than operators expect.
The relevant question is not "how big is the B2B order?" It is "what is the all-in profit per dollar of revenue across the cash conversion cycle, including working capital cost, account management cost, and credit loss?"
What the Decision Actually Hinges On
The Cash Conversion Cycle Gap
In DTC, the cash conversion cycle is: pay for inventory (or COD/30 days with suppliers), sell to customer, receive cash in 1–3 days. Net cash cycle: typically negative or zero — the customer pays before or as inventory is shipped.
In B2B, the cycle is: pay for inventory, ship to retailer, send invoice with Net 30 or Net 60 terms, wait for payment (often 45–75 days actual vs. terms), receive cash. Net cash cycle: 45–90 days. This means at any given time, the brand has 45–90 days of B2B revenue locked up in receivables that have not yet been collected. At $500K annual B2B revenue, that's $60,000–$125,000 of working capital permanently tied up in receivables. Growing the B2B business linearly grows the receivable balance — meaning every dollar of B2B growth requires a corresponding dollar of working capital growth.
The Account Management Overhead (Underestimated by 3x)
B2B accounts require active management that DTC doesn't: order confirmations, shipping coordination, return authorizations, chargeback disputes, payment follow-up, line-of-credit decisions, EDI integration, and the relationship maintenance that produces reorders. Brands new to B2B systematically underestimate this overhead, typically by 2–4x.
A single mid-tier retail account (10–30 stores) requires 2–6 hours/week of dedicated management — order processing, shipping coordination, dispute resolution, reorder management. At $35–$50/hour fully-loaded, that's $4,400–$15,600 of annual operational cost per account. A brand with 12 wholesale accounts is committing 24–72 hours/week of operational capacity — typically a full part-time employee or 0.5–1.0 FTE. This cost rarely shows up in the unit-economics model on the wholesale order.
Credit Risk and Chargeback Exposure
B2B carries credit risk that DTC doesn't. Retailers fail, refuse to pay disputed invoices, return shipments past the agreed-upon return window, and chargeback for damaged goods, late shipments, or missed PO compliance. Industry research from Atradius shows B2B average bad debt write-off rates of 1.5–3% of revenue in consumer goods, with another 2–4% in chargebacks for compliance issues (Atradius Payment Practices Barometer, 2024). At $500K annual B2B revenue, that's $17,500–$35,000 of write-offs and chargebacks that don't exist in DTC.
The biggest accounts often carry the highest concentrated risk — a single account representing 25% of B2B revenue going under or pulling its order book takes 25% of the segment with it. This is the structural risk that mature B2B operators manage actively through account diversification and credit insurance; new entrants typically don't, until the first major loss educates them.
The Cost Reality
The following table compares full unit economics on a $35 retail product, looking at DTC at MSRP, a single wholesale order, and the annual run rate of a 12-account B2B program at $500K revenue.
| Metric | DTC ($35 @ MSRP) | Single Wholesale Order (24-pack @ $420) | Annual B2B Program ($500K rev) | |---|---|---|---| | Revenue per unit | $35.00 | $17.50 | $17.50 avg | | COGS per unit | $10.50 (30%) | $10.50 | $10.50 | | Gross margin per unit | $24.50 (70%) | $7.00 (40%) | $7.00 | | Payment processing | $1.30 | $0 (ACH/check) | $0 | | Fulfillment cost per unit | $4.50 | $1.20 (pallet ship) | $1.20 | | CAC per unit | $7.00 | $0.50 (allocated) | $0.50 | | Account management cost | n/a | n/a | $9,000 (allocated) | | Working capital cost (60-day cycle @ 8%) | $0 | $1.40 | $0.40 (allocated) | | Bad debt + chargebacks | <0.5% | n/a | $0.60 (3% × $17.50) | | Contribution per unit | $11.70 | $3.90 | $3.50 | | Contribution margin % | 33.4% | 22.3% | 20.0% |
The DTC contribution margin of 33% drops to 20% when the B2B program's full cost structure (working capital + account management + bad debt) is properly allocated to the unit. The headline gross margin on the wholesale order looks acceptable — $7.00 per unit at 40%; the contribution margin after all true costs is half that.
The decision implication is not that B2B is bad. It is that B2B requires 1.5–2x the revenue volume of DTC to produce the same contribution dollars — and the working capital growth requirement makes scaling B2B fundamentally different from scaling DTC.
This connects to the wholesale-vs-DTC margin trade-off — the channel mix decision is a function of both contribution margin and working capital structure, not just the headline gross margin difference.
The Trade-Off Map
Pure DTC: Faster Cash, Higher Margin, Higher CAC
A pure DTC operation captures the full retail margin (70%+ in many categories) and receives cash immediately, but pays the full cost of customer acquisition. CAC of $20–$60 per customer is the structural cost of building the relationship that B2B doesn't have to pay. For categories with low organic discoverability and high CAC, the working capital advantage of DTC can be offset by acquisition spend.
B2B-Only: Slower Cash, Lower Margin per Unit, Faster Scale-Through-Account
A B2B-only operation captures wholesale margin (35–45% in most consumer goods) and waits 45–90 days for payment, but acquires customers through account relationships that, once established, produce repeat revenue with minimal incremental cost. The largest established consumer brands operate this way (sell through retail, no direct relationship) precisely because the account-based growth scales faster than DTC acquisition once the relationships are established.
Hybrid (Most Common at $1M+ GMV)
The configuration most brands settle into at $1M+ GMV is 60–80% DTC and 20–40% B2B. DTC provides the high-margin cash flow that funds operations and growth; B2B provides volume, distribution, and brand visibility in retail channels that DTC alone doesn't reach. The hybrid works only when the working capital implications are modeled — most brands that "discover B2B" without a working capital plan find themselves cash-constrained 6–9 months into the expansion.
The structural cost of hybrid: dual operational stacks (DTC fulfillment + B2B fulfillment, often through different 3PLs), dual pricing strategies that don't undercut each other, and dual marketing motions. The complexity is real and rises faster than revenue.
B2B-First, DTC-Second (The Inverse Pattern)
Some categories — particularly food service supplies, industrial parts, and certain beauty/personal care subcategories — operate primarily B2B with a DTC channel as a secondary revenue stream and brand-building surface. The DTC channel in these models is often a marketing channel disguised as a revenue stream — it generates content, customer feedback, and brand visibility that supports the B2B selling motion, while contributing modest direct revenue. Operators in this pattern measure the DTC channel as a customer acquisition cost line for the B2B business, not as a profit center in isolation.
When to Act (Specific Triggers)
Trigger 1: Stress-Test Working Capital Before First B2B Account
Before pitching the first B2B account, model the cash flow impact: assume 30% of next 6 months' revenue shifts to B2B with 60-day collection, and calculate whether the resulting receivables balance is sustainable given current cash reserves and credit lines. If the model shows a working capital gap of more than 60 days of operating expenses, the B2B expansion requires financing before it begins, not after.
Trigger 2: Hire Account Management at 5+ Accounts
The operational threshold where founder time becomes the bottleneck is typically 5 active retail accounts. Below that, the founder can handle order processing, dispute resolution, and reorder management directly. Above that, the time cost is consuming bandwidth that should be on growth. The hire — typically a B2B operations coordinator at $50,000–$70,000 base — pays back within 6–9 months in founder time recovered.
Trigger 3: Diversify When Top Account Exceeds 25% of B2B Revenue
The single-account concentration risk becomes structural at 25% of B2B revenue from one account. Below that, the loss of any account is manageable. Above that, the account has pricing leverage that compounds — and the loss is a material business event. Active account diversification (intentionally pursuing smaller accounts even at higher cost per acquisition) reduces this risk over 12–18 months.
Trigger 4: Reassess Terms at $250K B2B Annual Revenue
The default Net 30 / Net 60 wholesale terms are negotiating starting points, not fixed rules. At $250K+ annual B2B revenue, brands have enough volume to negotiate terms with new accounts: 2/10 Net 30 (2% discount for payment within 10 days), Net 30 only, or for new/risky accounts, deposit + balance terms. Tightening terms is the most direct working capital improvement available to growing B2B businesses.
What Operators Get Wrong Most Often
Mistake 1: Comparing AOV Instead of Contribution Margin
The most common framing error: "B2B orders are 10x the AOV of DTC orders — clearly more profitable." This is true on revenue per order and false on profitability per dollar. A $420 B2B order produces $84 of gross profit (at 40% margin) less working capital, account management, and bad debt allocation — typically $70 of contribution. A $35 DTC order produces $11.70 of contribution. Per dollar of revenue, DTC is materially more profitable — but it requires 12 times the order volume to produce equivalent revenue. The decision is about volume vs. velocity, not size of order.
Mistake 2: Underestimating Account Management Time
The second mistake is assuming B2B operations scale with revenue but not with operational time. They scale with both. A 6-account B2B program at $200K revenue takes roughly 12 hours/week of operational time. A 20-account program at $700K revenue takes roughly 35 hours/week. The operational time grows roughly with account count, not with revenue — meaning small accounts cost the same operational time as large accounts. This is why brands that take on many small wholesale accounts often find the program unprofitable on a fully-loaded basis.
Mistake 3: Skipping Credit Checks
The third mistake is extending Net 30 or Net 60 terms to new accounts without credit verification. A Dun & Bradstreet basic check costs $20–$60 per account and catches 60–80% of the accounts that will eventually default. Brands that skip this step typically experience their first significant bad debt loss in year 1–2 of B2B expansion, often at a magnitude that wipes out 6 months of program profit.
The Verdict
B2B is not DTC with bigger orders. It is a fundamentally different business model with different cash flow mechanics, different cost structure, and different operational requirements. The expansion can be very profitable; it requires deliberate working capital planning, deliberate account management infrastructure, and deliberate credit risk management. Brands that treat it as an upgrade to DTC typically discover within 12 months that the upgrade was a different business they didn't plan for.
This week: If you are running B2B and have not allocated working capital cost, account management time, and bad debt allowance to your wholesale unit economics, run that allocation. If the contribution margin drops more than 10 points below your headline gross margin, the program is operating less profitably than your reporting shows. If you are considering B2B expansion and have not run the cash flow stress test on the working capital implications, do that before signing the first account — not after.