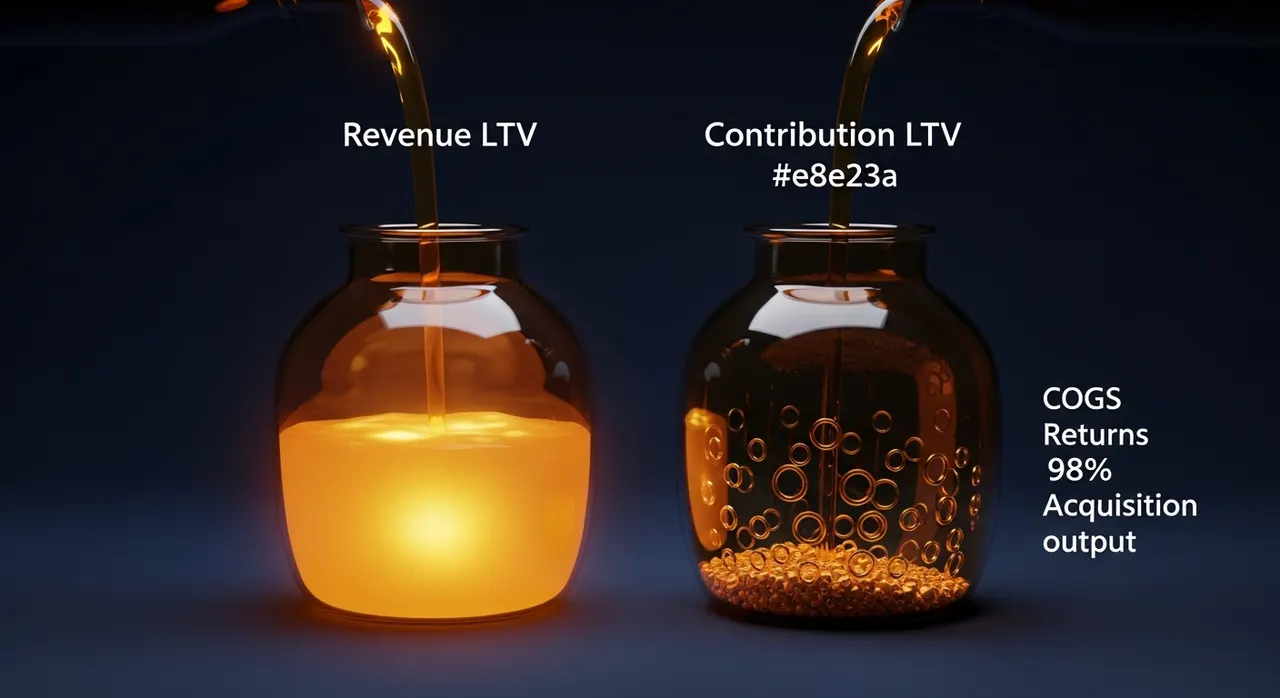
Your customer lifetime value number is probably 40–60% higher than it should be. Not because your customers are leaving faster than you think, but because you are measuring the wrong thing. Revenue-based LTV tells you what a customer spends. Contribution-margin LTV tells you what they are worth. The gap between those two numbers is what determines whether your paid acquisition is profitable or quietly bleeding cash — and most operators making budget decisions based on LTV figures have never calculated the second one.
The cost of this error is not theoretical. An operator running $500K in annual ad spend against a revenue LTV of $320 and a 3:1 target LTV:CAC ratio sets their acquisition ceiling at roughly $107 per customer. Correct that LTV down to $175 — after returns, refunds, fulfillment, and repeat CAC — and the same 3:1 target means they should be spending no more than $58 per customer. That $49 gap, multiplied across thousands of acquisitions, is the mechanism by which profitable-looking stores quietly become insolvent ones.
The Default Assumption (and Why It Fails)
The standard LTV formula taught across every eCommerce course and marketing playbook is: average order value × purchase frequency × customer lifespan. Some variants add a gross margin multiplier. Most operators stop there.
This formula fails because it treats revenue as value. It counts every dollar a customer spends without asking what the business actually keeps from that dollar after it has been spent.
Consider where it breaks specifically. A DTC apparel brand with an $85 average order value, 2.4 purchases per year, and a 3-year customer lifespan arrives at an LTV of $612. That number goes into the CAC ceiling calculation. It drives Facebook bid strategies. It informs decisions about how much to invest in loyalty programs.
But that $85 order has a return rate of 22% — the Baymard Institute puts apparel return rates at 15–30% for online purchases, with a median around 22% (Baymard Institute, 2024). When 22% of revenue is returned, effective revenue per order drops to $66.30. The refund processing, restocking, and re-listing costs add another $8–12 per returned unit (common for mid-market DTC brands managing their own 3PL), reducing the effective margin contribution further still.
None of this appears in the standard formula. The $612 LTV figure survives intact, steering acquisition budgets toward losses.
What the Decision Actually Hinges On
Your True Return and Refund Rate (by Cohort, Not Overall)
Most operators track return rate as a single blended number across the entire catalog. This masks a critical pattern: return rates differ substantially by product category, by acquisition channel, and by customer cohort.
Customers acquired through Facebook prospecting return at higher rates than customers acquired through organic search — typically 15–25% higher, because search-intent customers self-select for fit. A customer acquired via a "60% off" promotion returns at a higher rate than one who paid full price, because discount buyers are more likely to bracket sizes or hedge on style. Industry benchmarks for beauty and wellness hover at 5–8% return rates; for fashion they reach 20–30%; for electronics, 10–15%.
If your blended return rate is 18% but your paid social cohort returns at 26%, your LTV calculation for your largest acquisition channel is overstated by a compounding factor that grows with purchase frequency. The operator who corrects for this will set a lower — and more accurate — CAC ceiling for that channel specifically.
The Refund and Discount Leakage Nobody Models
Beyond returns, two other revenue leakages consistently go unmeasured. First, post-purchase discounts: the discount codes issued to unhappy customers as an alternative to returns. These typically run 15–20% of order value and appear in the revenue line as a regular transaction, not a markdown. Second, loyalty point redemptions: if you run a points program and a customer's third purchase is partially funded by redeemed points, the revenue figure for that transaction overstates the cash the business receives.
Neither of these appears as a separate line item in most LTV models. Together they can reduce effective revenue per order by 6–10% across a retained customer base.
The Repeat CAC Nobody Names
This is the variable that competitors consistently omit. Retaining a customer is not free. Every re-engagement email sequence has a delivery cost. Every win-back SMS campaign has a per-send cost. Loyalty program administration runs at 1–3% of revenue for brands with active programs. Paid retargeting to existing customers — which most brands running Meta or Google campaigns are doing, whether deliberately or via poor audience segmentation — adds a genuine acquisition cost to what appears to be an organic repurchase.
Klaviyo benchmarks suggest that the cost of email marketing infrastructure for a list of 10,000–50,000 subscribers runs $300–$800 per month (Klaviyo Email Benchmarks, 2024). For a brand with 8,000 active customers generating 2,000 repeat purchases per month, the email platform cost alone adds roughly $0.15–$0.40 per repeat transaction. Add retargeting spend leakage and loyalty costs, and the true repeat CAC is typically $5–$20 per repeat purchase, depending on channel mix. This needs to come out of LTV.
The Cost Reality
The corrected formula is:
Contribution-Margin LTV = (Effective Revenue per Order × Gross Margin) × Purchase Frequency × Lifespan − Repeat CAC × (Lifetime Purchases − 1)
Where Effective Revenue per Order = AOV × (1 − return rate) × (1 − post-purchase discount rate) × (1 − points redemption rate)
| Input | Inflated Model | Corrected Model | |---|---|---| | Average Order Value | $85.00 | $85.00 | | Return Rate | 0% (not modeled) | 22% | | Post-Purchase Discounts | 0% (not modeled) | 4% | | Points Redemption Leakage | 0% (not modeled) | 2% | | Effective Revenue per Order | $85.00 | $61.50 | | Gross Margin | 55% | 55% | | Gross Margin per Order | $46.75 | $33.83 | | Purchase Frequency (per year) | 2.4 | 2.4 | | Customer Lifespan (years) | 3 | 3 | | Lifetime Purchases | 7.2 | 7.2 | | Repeat CAC (per repeat purchase) | $0 (not modeled) | $12.00 | | Repeat CAC Total (6.2 repeat purchases) | $0 | $74.40 | | Calculated LTV | $336.60 | $169.64 | | Overstatement vs. Corrected | +98% | — |
This example uses conservative inputs. Brands with higher return rates (apparel, footwear) or heavier retargeting spend will see an even larger gap. The corrected LTV of $169.64 against a target LTV:CAC ratio of 3:1 implies a maximum first-purchase CAC of $56.55 — versus the $112.20 implied by the inflated model. Running campaigns at the inflated ceiling is a reliable mechanism for destroying margin at scale.
The Trade-Off Map
Using Revenue LTV (What Most Operators Do)
The upside is simplicity: the number is easy to calculate from Shopify reports, easy to communicate to a media buyer, and benchmarks well against industry LTV:CAC targets that are themselves calculated the same inflated way.
The downside is a systematically incorrect bid ceiling for every paid channel. At scale — above $200K annual ad spend — this compounding error is the difference between a business that grows into margin and one that grows into a cash crisis. The operators who survive this usually discover the error after the fact, when rising CAC meets declining gross margin and the cohort economics collapse.
Using Contribution-Margin LTV (The Correct Approach)
The upside is that every acquisition decision is made against a number that reflects actual economics. CAC ceilings are set by what you keep, not what flows through your merchant account. The model is also more useful for channel comparison: a channel that drives low-return customers is demonstrably more valuable than one driving high-return customers, even if AOV is identical.
The downside is calculation complexity. You need clean data on return rates by cohort, refund and discount tracking by customer, and a working definition of repeat CAC that your team agrees on. For brands below $300K GMV without a clean analytics stack, this requires deliberate instrumentation time — typically 2–4 weeks to get the underlying data into a usable state.
The Middle Path: Tiered LTV by Channel
A practical compromise is to calculate a single correction factor per acquisition channel. If your blended return rate is 18% but your paid social cohort returns at 26%, apply a channel-specific effective revenue multiplier to your LTV model for that channel only. This captures 70–80% of the correction benefit without requiring a full cohort analytics overhaul.
When to Act (Specific Triggers)
Signal 1: Your CAC Ceiling Is Higher Than You Think
Calculate your correction factor now if your blended return rate exceeds 12%. At that threshold, the gap between revenue LTV and contribution-margin LTV exceeds 20%, which is large enough to materially affect your CAC ceiling and therefore your channel profitability.
Rebuild your full LTV model if you are scaling paid spend above $20K per month. Below that level, a 30% LTV overstatement is painful but survivable. Above it, the compounding effect of overspending against an inflated ceiling becomes a solvency issue within 12–18 months of sustained growth.
Signal 2: Your Email Segmentation Is Based on False Frequency Data
Audit your repeat CAC if you have run a loyalty program for more than 12 months. The program has a real cost per retained customer, and that cost has not been subtracted from your LTV. Klaviyo, Yotpo, and Smile.io all export per-customer cost data that can be divided by active purchaser count.
Run a channel-level return rate report before your next paid acquisition budget cycle. This takes 30–45 minutes in most Shopify analytics setups and will tell you whether your highest-spend acquisition channel is generating customers who return at a disproportionate rate.
What Operators Get Wrong Most Often
Mistake 1: Using LTV to Justify CAC Instead of Constrain It
The most common mistake is using LTV to justify CAC rather than to constrain it. The LTV:CAC framework was designed as a ceiling, not a license. An operator who calculates a revenue LTV of $400, sets a 3:1 target, and tells their media buyer "spend up to $133 per customer" has inverted the purpose of the metric. The correct use is: calculate the accurate LTV, apply the ratio to find the ceiling, then verify that ceiling against actual cohort margin data before locking it in.
Mistake 2: Treating LTV as a Static Annual Number
The second most common mistake is treating LTV as static. LTV is not a number you calculate once. It is a function of your current customer mix, your current return rates, and your current product margin — all of which change quarter to quarter. A brand that recalculates LTV once per year and runs paid acquisition off that number for 12 months is making decisions based on conditions that no longer exist. A product launch mid-year that introduces a higher-return category, or a shift in channel mix toward paid social, can swing contribution-margin LTV by 15–25% within a single quarter — while the dashboard LTV figure sits unchanged, steering the media buyer into overspend.
The third mistake, visible only when you look at cohort-level data, is survivorship bias in the purchase frequency input. Operators calculate purchase frequency across all customers who made at least two purchases. This excludes the one-and-done buyers who never returned — who are, in most DTC brands, 50–70% of the first-purchase cohort (Shopify's internal data puts average repeat purchase rates at 27–34% for non-subscription DTC). Including the full first-purchase cohort in the frequency calculation reduces effective purchase frequency by 30–45%, and therefore reduces LTV by the same proportion, on top of the return-rate correction (Shopify Merchant Insights, 2024).
The Verdict
Revenue LTV is an accounting artifact. Contribution-margin LTV is a business decision. Calculate your effective revenue per order, apply your actual gross margin, subtract your real repeat CAC, and you have a number you can use. This week: pull your return rate by acquisition channel from Shopify Analytics, apply the correction factor to your current LTV, and compare the result to your active CAC ceiling. If the corrected LTV implies a lower ceiling than you are currently paying, you have identified an active cash leak — and you can close it before the next campaign cycle.