By Diosh — Founder, AHAeCommerce | eCommerce decision intelligence for $50K–$5M GMV operators
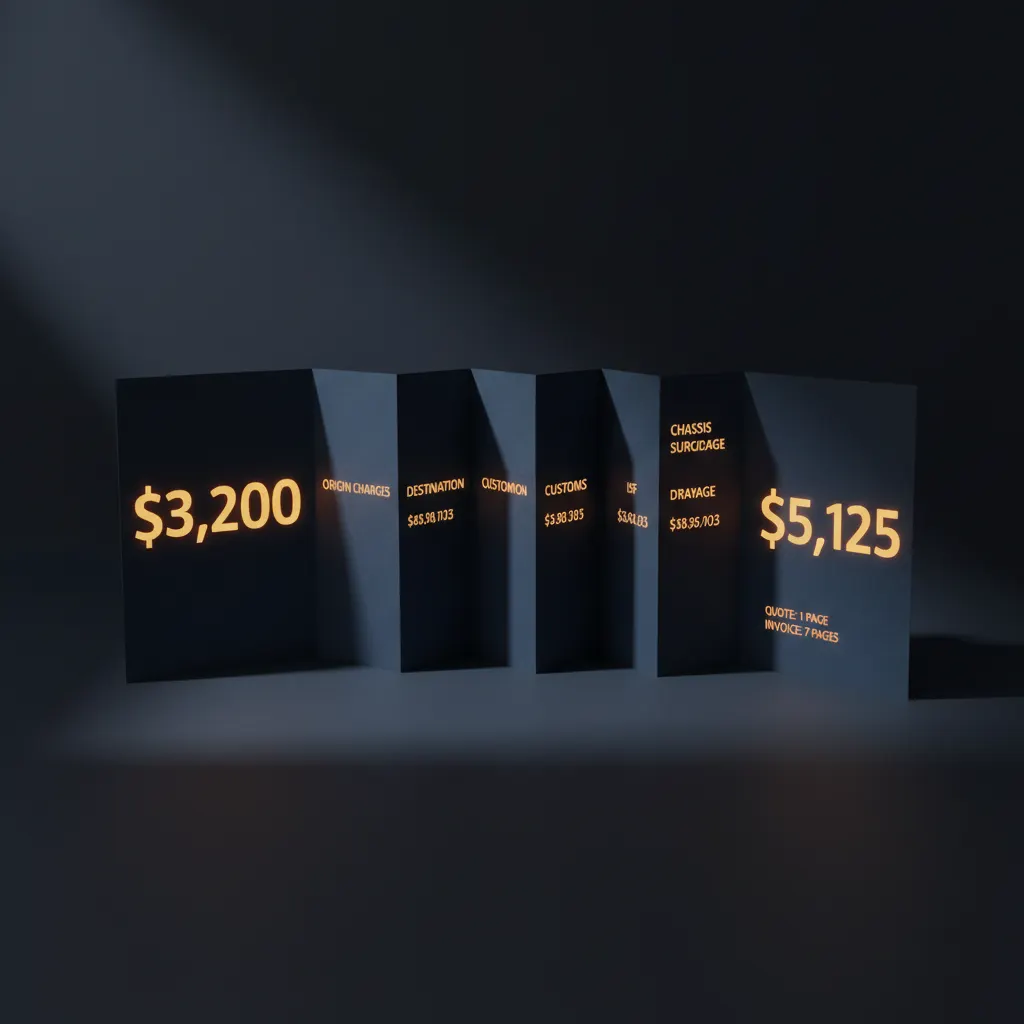
A $3,200 ocean freight quote for a 40-foot container from Shanghai to Los Angeles becomes a $5,100 final invoice after origin charges, destination charges, ISF filing, customs clearance, port fees, chassis rental, drayage to the warehouse, and the destination surcharge that wasn't on the quote. That's 59% higher than the quoted rate — not because the freight forwarder is deceptive, but because the quote covers ocean transit and the invoice covers everything else. Operators who plan inventory cash flow against the quote and not the invoice run their first shipment short by $1,500–$2,500 and learn the lesson the hard way.
The freight quote is not the freight cost. The gap is structural — every freight forwarder quotes the same way the industry quotes — and it is also predictable enough that you can build it into your import cost model before signing the first shipment.
The Default Assumption (and Why It Fails)
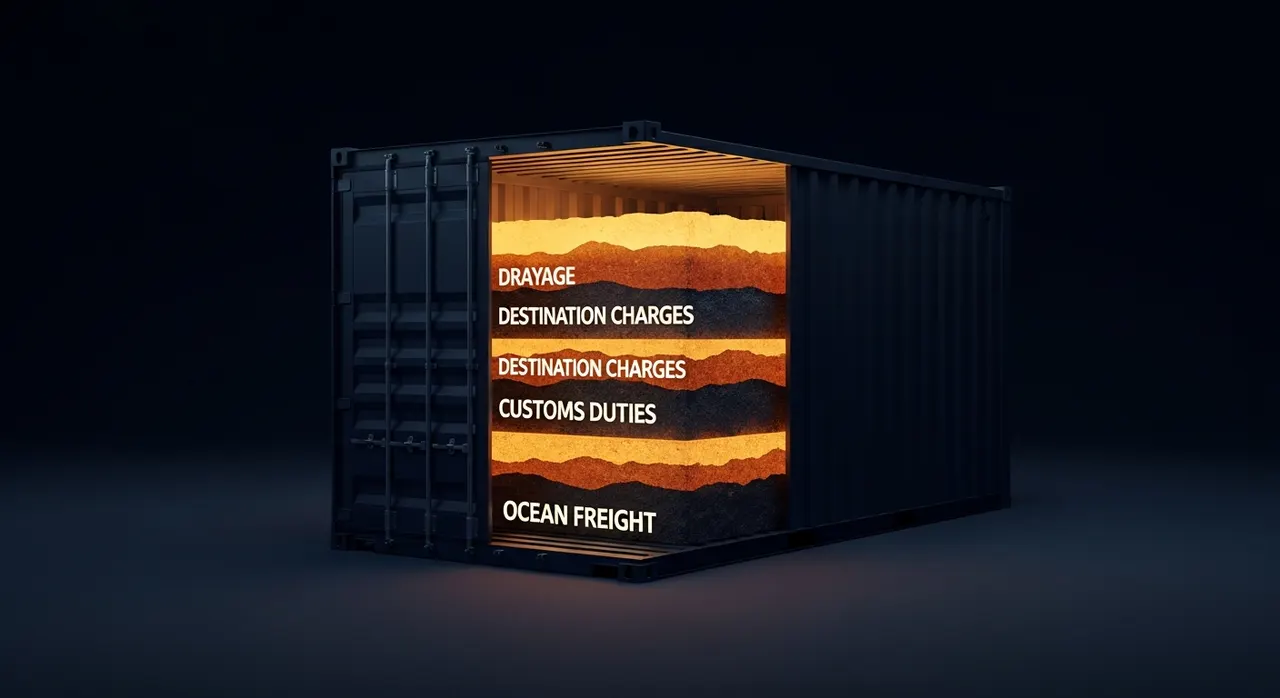
The standard mistake is treating the quoted freight rate as the freight cost. The quote covers the ocean (or air) transit segment from origin port to destination port. Everything before and after the transit — collectively 30–50% of total freight cost — is billed separately and frequently does not appear in the initial quote unless explicitly requested.
The Freightos Baltic Index tracks ocean freight rates with notable volatility — Trans-Pacific rates have moved from $1,800/FEU at trough to $20,000+/FEU during the 2021–2022 peak, with $2,200–$4,500/FEU as the typical 2023–2024 range (Freightos Baltic Index, 2024). The transit cost is the most visible and most volatile line. The fixed and semi-fixed surcharges around it move more slowly but consistently consume 30–50% of total spend.
The relevant question is not "what is the freight rate?" It is "what is the all-in landed cost per unit at my destination, and which line items are fixed vs. variable as my volume changes?"
What the Decision Actually Hinges On
The Origin Charge Stack (15–25% of Total Cost)
At the origin port (Shanghai, Ningbo, Yantian, Ho Chi Minh, etc.), the cargo accumulates charges before it ever leaves on the vessel. Typical line items: terminal handling charge (THC) — $180–$280/FEU; documentation fee — $50–$120; export customs clearance — $80–$180; container loading at the consolidator if LCL — $40–$80/CBM; warehousing for short-term storage; bunker adjustment factor (BAF) — variable with fuel; security charges — $40–$120.
A typical origin charge stack for a 40-foot container runs $400–$800. These charges are largely fixed per container and don't scale down with cargo value, meaning they consume a higher percentage of low-value shipments.
The Ocean Transit Segment (35–55% of Total Cost)
The line that the quote actually covers. Ocean freight rates are quoted in USD per FEU (40-foot equivalent unit) for FCL or per CBM (cubic meter) plus per metric ton (weight or measure, whichever is greater) for LCL. The headline rate is the dominant cost line for most shipments and the most volatile — driven by capacity, fuel cost, port congestion, and seasonal demand patterns.
Trans-Pacific eastbound (Asia to US West Coast) typically runs $2,400–$4,500/FEU in normal market conditions. Trans-Atlantic eastbound (Asia to US East Coast) runs $3,200–$5,800/FEU. Asia-to-Europe runs $1,800–$3,500/FEU. These rates can move 30–50% in either direction within a single quarter based on capacity and demand. Lock rates with multi-shipment contracts above 50 TEU/year to reduce volatility exposure.
The Destination Charge Stack (20–35% of Total Cost)
At the destination port, the cargo accumulates a second round of charges that mirror the origin side. Line items: terminal handling charge — $250–$400/FEU at major US ports; ISF filing (Importer Security Filing, required 24 hours before US arrival) — $35–$75; customs clearance — $100–$250; CBP exam fees if randomly selected for inspection — $250–$600; chassis rental — $35–$50/day during transit and unloading; drayage (truck movement from port to warehouse) — $400–$1,200 depending on distance; pier pass fees at California ports — $35–$50/container; demurrage if container exceeds free time — $100–$500/day.
A clean destination charge stack runs $1,200–$2,200. The variance is huge: a single inspection can add $400–$600; demurrage from a delayed pickup can add $300–$1,500. The destination side is where most of the "surprise" cost in freight bills lives.
The Cost Reality
The following table shows the full landed cost breakdown for a 40-foot container of mixed consumer goods, COGS $35,000, shipping Shanghai to Los Angeles to Inland Empire warehouse.
| Cost Component | Amount | % of Total Freight Cost | |---|---|---| | Origin Charges | | | | Terminal handling (origin) | $240 | 4.7% | | Documentation | $75 | 1.5% | | Export customs | $130 | 2.5% | | Bunker adjustment + security | $180 | 3.5% | | Ocean Freight Transit | | | | FCL rate Shanghai → LA/Long Beach | $3,200 | 62.7% | | Destination Charges | | | | Terminal handling (destination) | $320 | 6.3% | | ISF filing | $50 | 1.0% | | Customs clearance | $175 | 3.4% | | Pier pass | $40 | 0.8% | | Chassis rental (3 days) | $135 | 2.6% | | Drayage LA → Inland Empire | $580 | 11.4% | | Quoted (transit) cost | $3,200 | 62.7% | | Actual landed freight cost | $5,125 | 100% | | Variance vs. quote | +$1,925 | +60% |
The 60% gap between the quoted rate and the all-in freight cost is structural — it appears on every shipment from every freight forwarder. The operator who builds inventory cash flow against $3,200 per container will run consistently short by $1,800–$2,500 per container, which at a 10-container annual import program is $18,000–$25,000 of recurring cash flow surprise.
The implication for cross-border eCommerce cost planning is that landed cost per unit — not freight quote per container — is the only number worth using for pricing, margin, and inventory planning decisions.
The Trade-Off Map
FCL (Full Container Load) at $30K+ Order Value
A full container (20-foot ~30 CBM / 40-foot ~67 CBM, or ~26K kg payload) makes sense when your purchase order fills it — typically $25K+ COGS for consumer goods. The cost is roughly $5,000–$6,000 all-in to the US West Coast, or $180–$220/CBM equivalent. FCL provides faster transit (vessel-direct, less consolidator handling), lower damage risk, and simpler documentation than LCL.
The trap: shipping a half-full container "to lock in the FCL rate" without scaling to fill it. The fixed cost of the container makes the cost per CBM higher than LCL until you reach 60%+ fill. Below 60% fill, LCL is cheaper despite higher unit rates.
LCL (Less than Container Load) at $5K–$25K Order Value
LCL is shared container space, priced per CBM and per kilogram (typically billed on the greater of $80–$150/CBM or per-ton rate). The all-in cost for a 10 CBM LCL shipment runs $1,500–$2,800 — significantly more per CBM than FCL but appropriate when volume doesn't fill a container. LCL adds 5–10 days to transit time due to consolidation and deconsolidation, and has higher damage risk because cargo handles more.
The trap: not factoring the transit time penalty into inventory planning. LCL from Shanghai to a US warehouse typically takes 35–50 days door-to-door vs. 25–35 days for FCL. The additional inventory days affect cash flow and the SKU's reorder safety stock requirement.
Air Freight at Time-Sensitive or High-Value Shipments
Air freight runs 5–12x ocean rates per kilogram but transits in 3–7 days vs. 25–50 for ocean. Trans-Pacific air freight typically prices at $4–$8/kg in normal conditions, $8–$20/kg during peak season or capacity constraints. The cost makes sense for: high-value SKUs (where days of working capital matter), time-sensitive launches (where stock-out cost exceeds shipping premium), seasonal product replenishment late in the buying cycle, and high-margin products where the air premium is a small percentage of unit margin.
The trap: defaulting to air for every reorder. Air freight is a tactical tool for specific situations, not a default mode. Brands that air-freight routine replenishment shipments typically discover within 6 months that the practice is consuming 3–6 points of gross margin without corresponding benefit.
Direct-to-Customer Cross-Border (Beyond Freight Forwarding)
For some categories, direct-ship from origin to US customer (via 4PX, China Post ePacket, DHL eCommerce) skips traditional freight forwarding entirely. This works for low-AOV ($10–$50), low-weight, non-time-sensitive products. The math: $4–$15 per shipment direct from China to US customer, 12–25 day transit, no domestic warehousing needed. The trade-off: customer experience is dramatically worse than US-warehoused fulfillment, and any return needs to be handled in the US separately. The model is shrinking as de minimis import rules tighten in 2024–2025 and US-side enforcement increases.
When to Act (Specific Triggers)
Trigger 1: Request Door-to-Door Quotes, Not Port-to-Port
Most freight forwarders will quote port-to-port by default — the cleanest segment to price. The relevant cost is door-to-door (your supplier's factory to your warehouse), which includes the destination charges that vary widely. Specifically request a door-to-door quote with all surcharges itemized; reject quotes that don't break out the destination side.
Trigger 2: Audit the First 3 Freight Invoices Against the Quote
Pull the first 3 invoices from any new freight forwarder relationship and line-item compare them against the original quote. Identify any charges that weren't in the quote and ask for explanation. New forwarder relationships have a calibration period of 2–4 shipments during which "surprise" charges should be challenged. After the third shipment, the patterns are clear and you can move to a clean invoice review process.
Trigger 3: Renegotiate at 50+ TEU Annual Volume
Annual freight volume of 50+ TEU (full containers or LCL equivalent) qualifies for direct rate contracts with the steamship lines through your forwarder. The savings vs. spot market rates are typically 15–25% with rate stability through the contract period (usually 12 months from May to April). Forwarders won't proactively offer this; ask.
Trigger 4: Track Free Days and Demurrage
Containers have free time at destination ports — usually 4–7 calendar days from vessel discharge. Beyond free time, demurrage charges of $100–$500/day apply. Operators who don't track free time pay demurrage charges that compound rapidly during peak season when trucking capacity is tight. Track free day expiration on every container; have drayage scheduled within 48 hours of vessel discharge.
What Operators Get Wrong Most Often
Mistake 1: Comparing Forwarders on the Quoted Rate Alone
The most common mistake is selecting freight forwarders on the lowest quoted rate. Quoted rates are negotiable and largely commoditized; service quality, document accuracy, and clear communication on surcharges vary dramatically. A forwarder that quotes $200 lower but generates two invoice disputes per shipment costs more than a forwarder with a slightly higher quote and clean invoices.
Mistake 2: Treating Demurrage as Bad Luck
Demurrage charges feel like surprise events; they are operational failures. Tight scheduling of drayage on container arrival, advance customs documentation, and active monitoring of vessel discharge are the operational practices that prevent demurrage. Brands that experience demurrage repeatedly have a logistics coordination problem, not a freight forwarder problem.
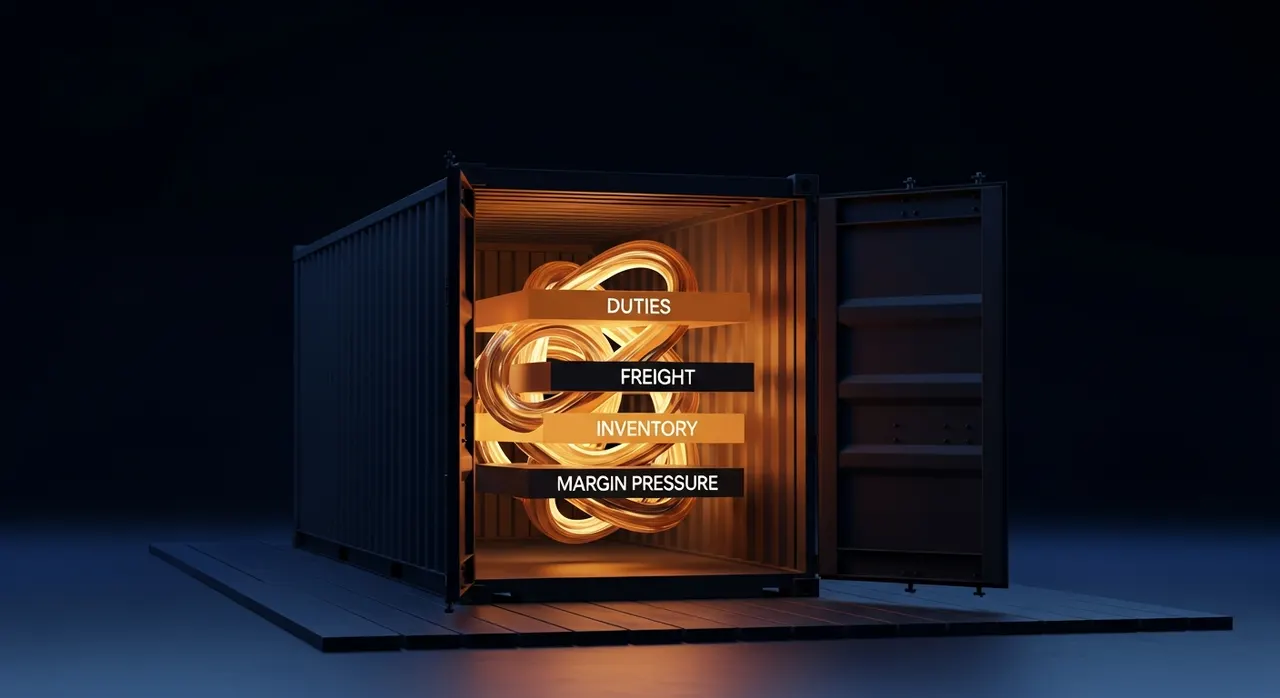
Mistake 3: Quoting Margin Off the Freight Rate Instead of Landed Cost
The third mistake bleeds slowly: pricing products based on COGS plus freight rate, when the real landed cost is COGS plus freight rate × 1.5–1.7. A brand that prices a $35 retail product against $10 landed cost ("$8 COGS + $2 freight per unit") when the real landed is $11.50 is operating at 67% gross margin when it thinks it's at 71%. Over 12 months, this 4-point error compounds into meaningful operating decisions made on bad data.
The Verdict
The freight quote is the visible 60–65% of total freight cost. The remaining 35–40% lives in origin and destination charges that appear on the invoice and not in the quote. Operators who build cash flow, pricing, and unit economics off the quote rather than the all-in landed cost are working with the wrong number — and the variance compounds across every container imported.
This week: Pull your last 3 freight invoices, line-item every charge against the original quote, and calculate your actual ratio of all-in cost to quoted cost. If the ratio exceeds 1.4x and you are pricing products against quoted-rate landed cost, your gross margin reporting is overstating reality by 3–6 points. Update the landed cost in your inventory system before the next pricing or PO decision.