By Diosh — Founder, AHAeCommerce | eCommerce decision intelligence for $50K–$5M GMV operators
This is a trade-off piece for operators who have either been approached by an aggregator with a term sheet or are considering acquiring a competitor under a holding structure. The roll-up thesis — buy small brands, layer shared services, expand margin — is not wrong as a sentence. It is wrong as a default. The trade-off nobody quantifies upfront is the gap between the synergy assumption priced into your multiple and the synergy that actually compounds in the P&L. When that gap is large enough, the buyer multiple itself becomes the entire equity story, and you are buying or selling a financial instrument, not a portfolio of brands. This article gives you the arithmetic to run before you sign.
What the Thrasio collapse actually proved
Thrasio raised roughly $3.4 billion in equity and debt, peaked at a stated $10 billion valuation in 2021, and filed for Chapter 11 in the U.S. Bankruptcy Court for the District of New Jersey on February 28, 2024 with a plan to shed about $495 million of debt and take on $90 million in new financing, per TechCrunch's reporting on the filing. By September 2023, secondary market platform Forge Global was estimating the company at $193.9 million. The shorthand "Thrasio failed because the model is broken" is operator folklore. It is also wrong in a way that will cost you money if you act on it.
The model did not fail because consolidating Amazon brands is impossible. It failed because the buyer multiple was the equity story. Aggregators raised about $12.3 billion in 2021 alone, roughly 75% as debt, according to Marketplace Pulse. With more than 100 aggregators competing for a finite pool of profitable Amazon FBA brands, acquisition multiples drifted from 2x EBITDA (when Thrasio was effectively the only buyer in 2018) to 4–5x and, in exceptional cases, 7x by 2021, per Marketplace Pulse's "Death by Valuation" autopsy.
That sounds like private-equity-style discipline until you decompose it. A 4–5x EBITDA multiple is sane only if the EBITDA being purchased is durable. The EBITDA being purchased was not durable. It was a function of an Amazon advertising arbitrage window that started closing in 2021. Average Amazon CPC roughly doubled between 2020 and 2022 across multiple datasets, and continued climbing through 2023. A $1.2M GMV home-goods brand purchased on a $300K EBITDA basis at a 4.5x multiple ($1.35M price tag) needed CPC to behave like 2020 to clear that hurdle. CPC did not behave like 2020. The same brand 18 months later was running at a $180K EBITDA — same revenue, half the contribution margin — and the implied multiple paid was suddenly 7.5x of degraded earnings. That is the failure mode.
The corollary nobody underlines
Razor Group and Perch merged in March 2024 at a combined $1.7 billion enterprise value with about $400 million of debt on the balance sheet, reported by TechCrunch. The aggregator space did not stop existing. It re-priced. If you are an operator inside this market, your job is to understand whether the re-priced version makes the math work — for you, not for the aggregator's slide deck. For a deeper look at how multiples shift when assumptions move, see the exit math nobody does.
Where roll-up margin actually comes from
Strip away the slide deck and roll-up margin compounds only when three specific things compound together. They almost never do.
Shared supply chain only works on adjacent SKUs
A consolidated freight contract, shared 3PL pallets, and one purchase order to a Vietnamese factory only produce real savings if the SKUs are genuinely adjacent — same HTS code family, similar cube, similar seasonality, similar freight lane. A holding company owning a dog-bed brand, a kitchen-knife brand, and a Bluetooth-speaker brand has three separate supply chains. The "consolidated" 3PL bill drops 2–4 points of contribution margin, not the 8–12 the deck modeled. If you are evaluating a buyer's synergy claims, ask for the actual landed-cost-per-unit pre and post their last three acquisitions. They will either send the data or they will not. Both answers are informative. The structural economics of freight at scale are not negotiable; freight forwarding economics is the corrective.
Shared customer base only works on adjacent brands
Cross-sell email lists work when the second brand sells to the same buyer at the same lifetime moment. A camping brand emailing its list about another camping brand can move a 1–3% conversion. The same camping brand emailing about cookware moves 0.0–0.4%. Most aggregators bought across categories specifically to diversify Amazon risk, and in doing so eliminated the precondition for shared-customer-base synergy. You cannot have both diversification and CRM compounding. Choose one and price it honestly.
Shared ops talent only works at scale solo operators cannot reach
This is the legitimate synergy and the one most often underestimated by sellers. A $1M GMV brand cannot afford a head of Amazon advertising who has run $80M of spend. A holding company with twelve brands can. That hire alone can drive 1.5–3 points of margin across the portfolio if compensated against contribution, not gross spend. The problem is that the largest aggregators replaced "expensive specialist" with "junior brand manager pool managing too many SKUs." Synergy reverses. The acquired brand's ad efficiency frequently deteriorates inside the parent. If you are a seller, ask the buyer how many SKUs each brand manager owns post-acquisition. The honest answer is usually 40–80. The marketing-friendly answer is 10–15. Verify before believing.
If a buyer cannot make all three of these compound on your specific brand, the synergy line in the IRR model is theater. Most achieve none of the three on most acquisitions. That is not a Thrasio-specific failure; it is the base rate.
How to model the buyer's IRR honestly before you sell
The single most valuable thing a $500K–$3M GMV brand owner can do during diligence is build the buyer's three-year IRR model with their own conservative assumptions, then compare it to whatever the buyer is pitching internally. You will see the gap.
The realistic synergy assumption is zero
Set synergy to zero. Not optimistic-zero, actual zero. No 3PL savings, no shared marketing efficiency, no platform-level overhead absorption in the first 24 months. This is not pessimism; it is the empirical base rate for the first two years post-acquisition across public reports on aggregator portfolio performance from Modern Retail, where most acquired brands underperformed pre-acquisition forecasts in the first 18 months.
Lifetime value compresses 15–25% post-acquisition
This is the unglamorous reality of brand stewardship under aggregators. Customer service ticket-resolution time roughly doubles. PDP refresh cadence drops from monthly to quarterly. Listing variation expansions get queued behind 40 other brands. The result is a 15–25% LTV compression within 18 months for brands acquired into multi-brand portfolios. Bake that into the IRR. If the buyer is paying 4.5x EBITDA against your last twelve months and your EBITDA quietly degrades 20% post-close, the implied multiple paid against year-three EBITDA is 6–7x. The buyer either knew this and underwrote it, or they didn't and the deal will quietly impair on their balance sheet 18 months in. Either way, it is information.
Earn-outs are the entire negotiation
When the buyer's synergy assumptions are aggressive and your conservative model says they won't materialize, the negotiation moves from headline price to earn-out structure. A 4.5x deal with 60% cash at close and 40% earn-out tied to a forward EBITDA target you control is a different transaction than a 4.5x deal with 80% cash at close. In a re-priced 2024–2026 aggregator market, the cash-at-close component frequently sits at 50–65%. The headline multiple has become a marketing number. Run the IRR on cash received, not on enterprise value claimed. The methodology overlaps directly with the exit math nobody does, which is the prerequisite read before any term sheet conversation.
How to validate target brand fit before you buy
If you are the operator considering acquiring a competitor brand under a holding structure — not a venture-backed aggregator, just a $2M–$10M GMV operator buying a $400K–$1.5M GMV adjacent brand — the math is more favorable but the diligence discipline must be the same.
The CAC test
Pull the target's last 24 months of CAC by channel. Then model your CAC by channel for the same SKUs run through your existing ad accounts, your existing creative team, and your existing audience pools. If your blended CAC on the target's products would be more than 15% lower than what they're running, the deal makes operational sense. If it would be 0–10% lower or higher, you are paying for a brand label, not an operational improvement. Most acquirers cannot honestly project CAC reduction because they have never run that category before. The realistic projection is "the same CAC for 12 months, then maybe 5–8% lower in year two as we learn the creative." If that's the projection, the multiple you pay must reflect it.
The retention test
A brand with 35% repeat purchase at 90 days is structurally different from a brand with 8%. Aggregators famously paid the same multiple on both. You should not. Model out the target's existing cohort curves. Project the change post-acquisition (it will almost certainly degrade in months 1–12 — see LTV compression above). Decide whether you are paying for current retention or aspirational retention. Operators who skip this step end up subsidizing retention with paid ads, which is exactly the trap that scaling before readiness was designed to warn against.
The supply chain overlap test
This is the only synergy you can underwrite honestly before signing. List every SKU in the target. List your existing freight lanes, factory relationships, 3PL pallet positions, and HTS-code expertise. Score the overlap on a 0–5 scale per SKU. If the portfolio-weighted overlap score is above 3.5, you have a real shared-supply-chain thesis. Below 2.0, you are buying logistics complexity, not consolidating it. Between 2.0 and 3.5, you are guessing — and guessing on freight is a losing trade. The brand-side equivalent — own infrastructure vs. marketplace dependency — is a related call covered in Amazon vs. own store.
The platform-risk test
If the target derives more than 70% of revenue from Amazon, you are buying platform-distribution risk, not brand equity. Aggregators learned this lesson at $3 billion of write-downs. The diligence question is not "what is Amazon revenue today" but "what is the probability and cost of de-platforming, account suspension, or category-level ad-cost re-pricing in the next 24 months." If you cannot answer that with a number, you cannot underwrite the deal. The framework for de-platforming risk and exit ramps is the eCommerce kill switch.
The DTC roll-up variant: why it usually fails worse
Most of the above assumed Amazon-first targets. The DTC-first roll-up variant — buying Shopify brands and consolidating warehousing, customer service, and paid social — fails for the same structural reasons but the failure is uglier because the margin starting point is thinner.
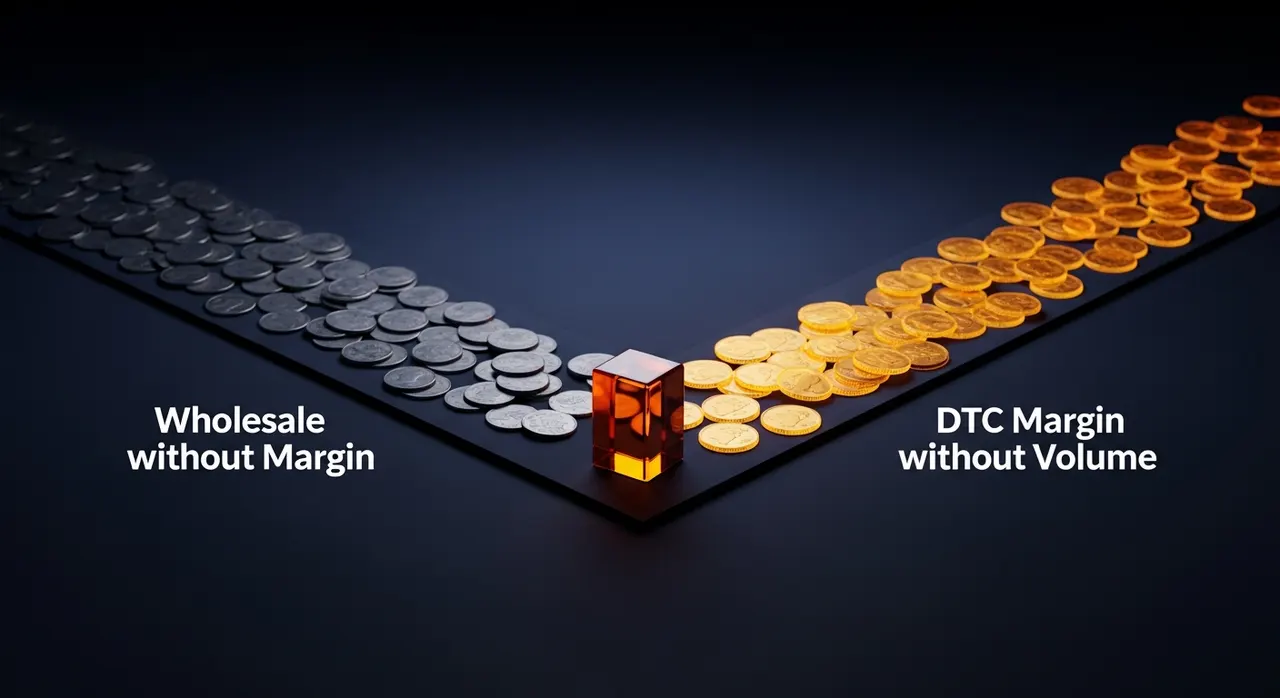
DTC contribution margin on a $1–3M GMV brand commonly sits in the 18–28% range pre-overhead, depending on category and channel mix — the structural comparison is in wholesale vs. DTC margin. A 4x EBITDA buyer needs that contribution margin to expand, not contract, post-acquisition. Paid social CAC is more correlated across DTC brands than aggregators initially assumed, which means "diversify our Meta exposure" doesn't actually work the way the deck claims. When iOS 14.5, then iOS 17, then the 2024–2026 attribution shifts hit, the entire portfolio's CAC moved in the same direction at the same time. That is the opposite of diversification — it is correlated single-platform exposure dressed up in multiple brand names.
The roll-up math for DTC consolidators that survived 2022–2024 looks like this: keep portfolio under 6 brands, share only the actual shared functions (3PL, customer service tier 1, finance), do not consolidate creative or brand management, and pay 2.5–3.5x EBITDA on cash-heavy structures. That is a real business. It is not the venture-backed roll-up. It is a boring holding company. Boring holding companies are how the survivors are quietly compounding while the headline-grabbing aggregators restructure.
What to actually do this week
If you are a seller in conversations with an aggregator or a strategic buyer: build the three-year IRR with synergy = 0 and LTV compression of 20%, then compare to the model the buyer is selling you internally. Negotiate against the gap. Push earn-out structure aggressively. Demand cash-at-close above 65% for any brand the buyer cannot prove operational synergy on within the first 90 days post-close.
If you are an operator considering an acquisition: run the four-test framework (CAC, retention, supply chain overlap, platform risk). Refuse to underwrite synergy that has not been demonstrated on at least one prior portfolio addition. If you have never acquired a brand before, the supply-chain-overlap test is the only synergy you should price into the multiple. The rest is your future learning curve, paid for in cash today.
If you are neither — operating your own single brand and watching the aggregator news from the sidelines — the same arithmetic applies in reverse. The reason your brand is hard to scale past $5M GMV alone is the same reason aggregators couldn't make twelve brands cheaper to run than one: shared services don't compound unless the underlying portfolio actually shares something. Pick what your next dollar of revenue is buying — a new SKU adjacent to your existing freight lane, a new customer cohort adjacent to your existing CRM, or new ops talent your current scale can afford. If the answer is "all three at once via a parent company," you have rebuilt the Thrasio thesis. It is a sentence. It is still not a default. Run the math.